
AMD Ryzen 7 9800X3D vs AMD Ryzen 9 9950X3D
Does the 9950X3D’s measured lead in several multi-threaded creator tests matter enough to choose it when the cited gaming suite shows near-average-FPS parity?
Products compared
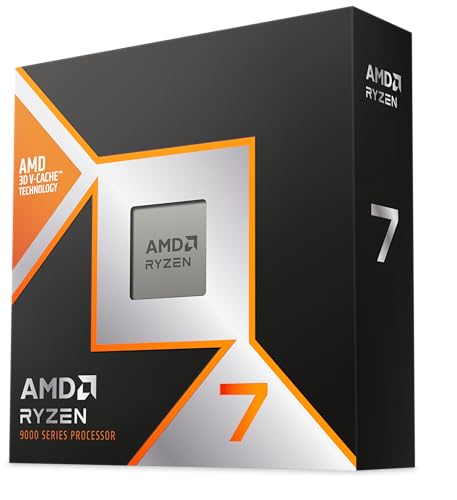
ASIN B0DKFMSMYK
AMD Ryzen 7 9800X3D
Gaming is your main workload and the source-specific near-parity result is enough to guide your choice.
Last observed offer
$444.00
List Price: $479.00
- Confirm offer eligibility on Amazon
Price checked
Observed condition: new. Coupon and subscription requirements unverified.

ASIN B0DVZSG8D5
AMD Ryzen 9 9950X3D
You regularly render, encode or run similar multi-threaded work and the cited Cinebench 2024, POV-Ray and HandBrake x265 results match the tasks you care about.
Last observed offer
$624.00
List Price: $699.00
- Confirm offer eligibility on Amazon
Size: 1.6" x 1.6"
Price checked
Observed condition: new. Coupon and subscription requirements unverified.
Prices are per listed package. Pickoryx may earn a commission from qualifying purchases through the paid Amazon links on this page, at no added cost to you.
Published by Pickoryx · Published 2026-10-23 · Source checked 2026-10-23 03:57 UTC
The main trade-off
In Tom’s Hardware’s cited 16-game test, average gaming results were nearly even; its separate multi-threaded rendering and encoding tests favored the 9950X3D. The choice depends on which workloads you actually run.
Quick verdict
For gaming alone, Tom’s Hardware’s cited test found nearly the same 16-game average FPS for both CPUs, with small differences in the 1% lows and individual games. For frequent multi-threaded rendering or encoding, its named creator tests favored the 9950X3D. Choose by workload, then compare current offers; these results do not predict every game or application.
Choose AMD Ryzen 7 9800X3D if
- Gaming is your main workload and the source-specific near-parity result is enough to guide your choice.
- You do not regularly use the cited multi-threaded creator workloads and the 9800X3D is the better fit among your current offers.
Choose AMD Ryzen 9 9950X3D if
- You regularly render, encode or run similar multi-threaded work and the cited Cinebench 2024, POV-Ray and HandBrake x265 results match the tasks you care about.
When the recommendation changes
- A workload mix that includes frequent, well-threaded rendering or encoding makes the 9950X3D’s cited creator-test results more relevant; a gaming-only use case makes those results less decisive.
The differences that matter
| Decision point | AMD Ryzen 7 9800X3D | AMD Ryzen 9 9950X3D |
|---|---|---|
| Tested Gaming Workload Fit | 195.5 average FPS; 134 FPS 1% lows in the reported 16-game geometric mean.[1] | 194.8 average FPS; 136 FPS 1% lows in the same reported 16-game geometric mean.[1] |
What this changes: The near-identical average in this test supports a workload-based decision rather than assuming a gaming advantage from model tier; game-level and 1% low results vary.[1] The better fit depends on your priorities | ||
| Tested Creator Productivity Workload Fit | Comparison baseline in the cited multi-threaded Cinebench 2024, POV-Ray and HandBrake x265 tests.[1] | Reported leads of 43% in Cinebench 2024 multi-core, 69% in POV-Ray multi-core and 63% in HandBrake x265 versus the 9800X3D.[1] |
What this changes: These results can favor the 9950X3D for a buyer whose repeated creator work resembles those measured multi-threaded tasks; they do not guarantee the same gain in other applications.[1] Best fit: AMD Ryzen 9 9950X3D | ||
Best for your routine
Gaming-focused build using workloads like the cited test suite
The better fit depends on your priorities
The cited 16-game average-FPS results were nearly even, while 1% lows and individual game results varied; these measurements do not justify a universal gaming winner.
Frequent multi-threaded rendering or encoding similar to the cited tests
Best fit: AMD Ryzen 9 9950X3D
In Tom’s Hardware’s faceoff, the 9950X3D led the 9800X3D in the named multi-threaded Cinebench 2024, POV-Ray and HandBrake x265 tests.
Value and trade-offs
One or both observed offers have eligibility conditions, so no unrestricted price difference is shown.
If the 9950X3D carries a higher current offer, the source-backed reason to consider that premium is its lead in the cited multi-threaded creator tests. Whether that trade-off is worthwhile depends on how often your own software uses those workloads.
The available price evidence has no usable historical window, so it cannot establish whether today is a good time to buy; compare current seller, condition and offer terms when you decide.
Limitations
- Gaming results are from Tom’s Hardware’s 16-game geometric mean at 1080p with High/Ultra settings and an RTX 5090; they are not a prediction for every game, resolution, GPU or system.
- The creator comparison is limited to the named tests reported by Tom’s Hardware. Other programs, settings and workloads may scale differently.
- AMD lists default TDP ratings and cooler guidance, but those ratings are not measured system power, temperature, noise or proof that a particular cooler is adequate.
- No usable price-history window was available for this comparison; current offers and seller terms can change.
Questions shoppers ask
Does the 9950X3D deliver a clear average-FPS gain in the cited gaming test?
Not in the reported 16-game geometric mean: Tom’s Hardware measured 195.5 FPS for the 9800X3D and 194.8 FPS for the 9950X3D at 1080p High/Ultra with an RTX 5090. Its 1% lows and individual game results differed, so treat this as one test setup rather than a universal result.
When does the 9950X3D’s creator-test lead matter?
When you often run similar multi-threaded work. In the cited faceoff, it led in Cinebench 2024 multi-core, POV-Ray multi-core and HandBrake x265; the reported margins should not be assumed for other software.
Methodology and sources
Compared the exact boxed-product identifiers against AMD’s official pages, then assessed Tom’s Hardware’s reported gaming and multi-threaded creator results within their stated test conditions. No performance was inferred from core counts, clock ratings or TDP.
Automation organized the supplied exact-product records and the opened manufacturer specifications and independent benchmark results; it did not run hardware tests.
View 3 sources
- 1.AMD Ryzen 7 9800X3D vs AMD Ryzen 9 9950X3D faceoff — the battle of AMD’s fastest gaming chipsTom’s Hardware · Independent testing · Source checked 2026-10-23 03:57 UTC
Evidence used on this page
- Hassam Nasir, updated September 9, 2025; “Gaming Benchmarks and Performance” (1080p, RTX 5090, 16-game geometric mean) and “Productivity Performance” (Cinebench 2024, POV-Ray, HandBrake x265), article lines 515–521, 617–618, 813–818 and 988–991.: The article directly tests both exact CPUs. In its stated 1080p High/Ultra 16-game geomean it reports 195.5 vs 194.8 average FPS and 134 vs 136 FPS in 1% lows; it reports 9950X3D leads of 43% in Cinebench 2024 multi-core, 69% in POV-Ray multi-core and 63% in HandBrake x265. Results are bounded to the article’s test suite and configuration.
- 2.AMD Ryzen 9 9950X3D Gaming and Content Creation ProcessorAMD · Official specifications · Source checked 2026-10-23 03:57 UTC
Evidence used on this page
- Specifications: product name, boxed product ID 100-100000719WOF, 16 cores/32 threads, AM5, default TDP 170W; thermal solution not included and liquid cooler recommended for optimal performance.: AMD’s official product page identifies the boxed 9950X3D as product ID 100-100000719WOF and lists its published processor specifications and cooler guidance. TDP is a rated specification, not measured system draw.
- 3.AMD Ryzen 7 9800X3D Desktop ProcessorAMD · Official specifications · Source checked 2026-10-23 03:57 UTC
Evidence used on this page
- Specifications: product name, boxed product ID 100-100001084WOF, 8 cores/16 threads, AM5, default TDP 120W; thermal solution not included and liquid cooler recommended for optimal performance.: AMD’s official product page identifies the boxed 9800X3D as product ID 100-100001084WOF and lists its published processor specifications and cooler guidance. TDP is a rated specification, not measured system draw.